
Master’s Thesis of Science
Genome-Wide Association Study of Rice Grain Morphology Combined with Micro-CT Phenotyping
“Relationship between rice inner structure and DNA.”
Project type
Research
Agriculture
Bioinformatics
Tool
Python
R studio
3D Slicer
Time
July. 2021 - Feb. 2023
(1.5 yrs)
Role
Student Researcher
Overview
I was a student researcher in the Crop Molecular Breeding lab, where I studied relationship between appearance and DNA of the rice using micro-CT. I was responsible for the entire research process, from hypothesis development to experiment design and execution, and data analysis and interpretation.
Introduction
Rice, scientifically known as Oryza sativa L., is one of the most important staple crops worldwide. It is a major source of food for over half of the global population. To meet the growing demand for rice and increase crop productivity and profitability, farmers and breeders aim to produce varieties that have high yield, disease resistance and grain quality. A key factor in this challenge is grain morphology, which is closely linked to yield and grain quality.
Background
Brown rice, the whole grain with only the husk removed, is composed of endosperm, embryo, and bran layer. The grain morphology is a crucial aspect to understand in rice breeding, as it is closely related to both yield and grain quality. Despite the importance of grain internal structure for plant breeding and crop improvement, research in this area has been limited as compared to the extensive studies that have been conducted on grain shape and size. This is predominantly due to the grain's delicate structure, compact size, and opaque characteristics.

Problem
How can we clearly see inside a rice grain? Past research on other grains like oats and corn used imaging science tools like microcomputed tomography (micro-CT). These scans show the inner details up to the nano level without breaking the seed. This imaging technique was combined with genotype data to conduct a GWAS to identify genetic regions that control grain internal morphology. The results from this study offer valuable information on the genetics of grain internal structure and can be used in rice breeding.
a
b
Figure 1. Inner structure of rice(Oryza Sativa L.)


c

Figure 2. Visualizing Rice Grain Morphology (a) Diagram illustrating the principle of micro-CT; (b) Sequential Sectioned Imaging of Rice Grain; (c) 3D Reconstruction of Rice Grain Showing Distinct Internal Structures.
Method
In order to understand the genetic background of an appearance characteristic using GWAS, the phenotype(appearance) and genotype(genetic) data must be collected.
Sampling
A total of 215 rice accessions were cultivated in Suwon, South Korea, using conventional lowland cultivation methods and natural long-day conditions.


Phenotype
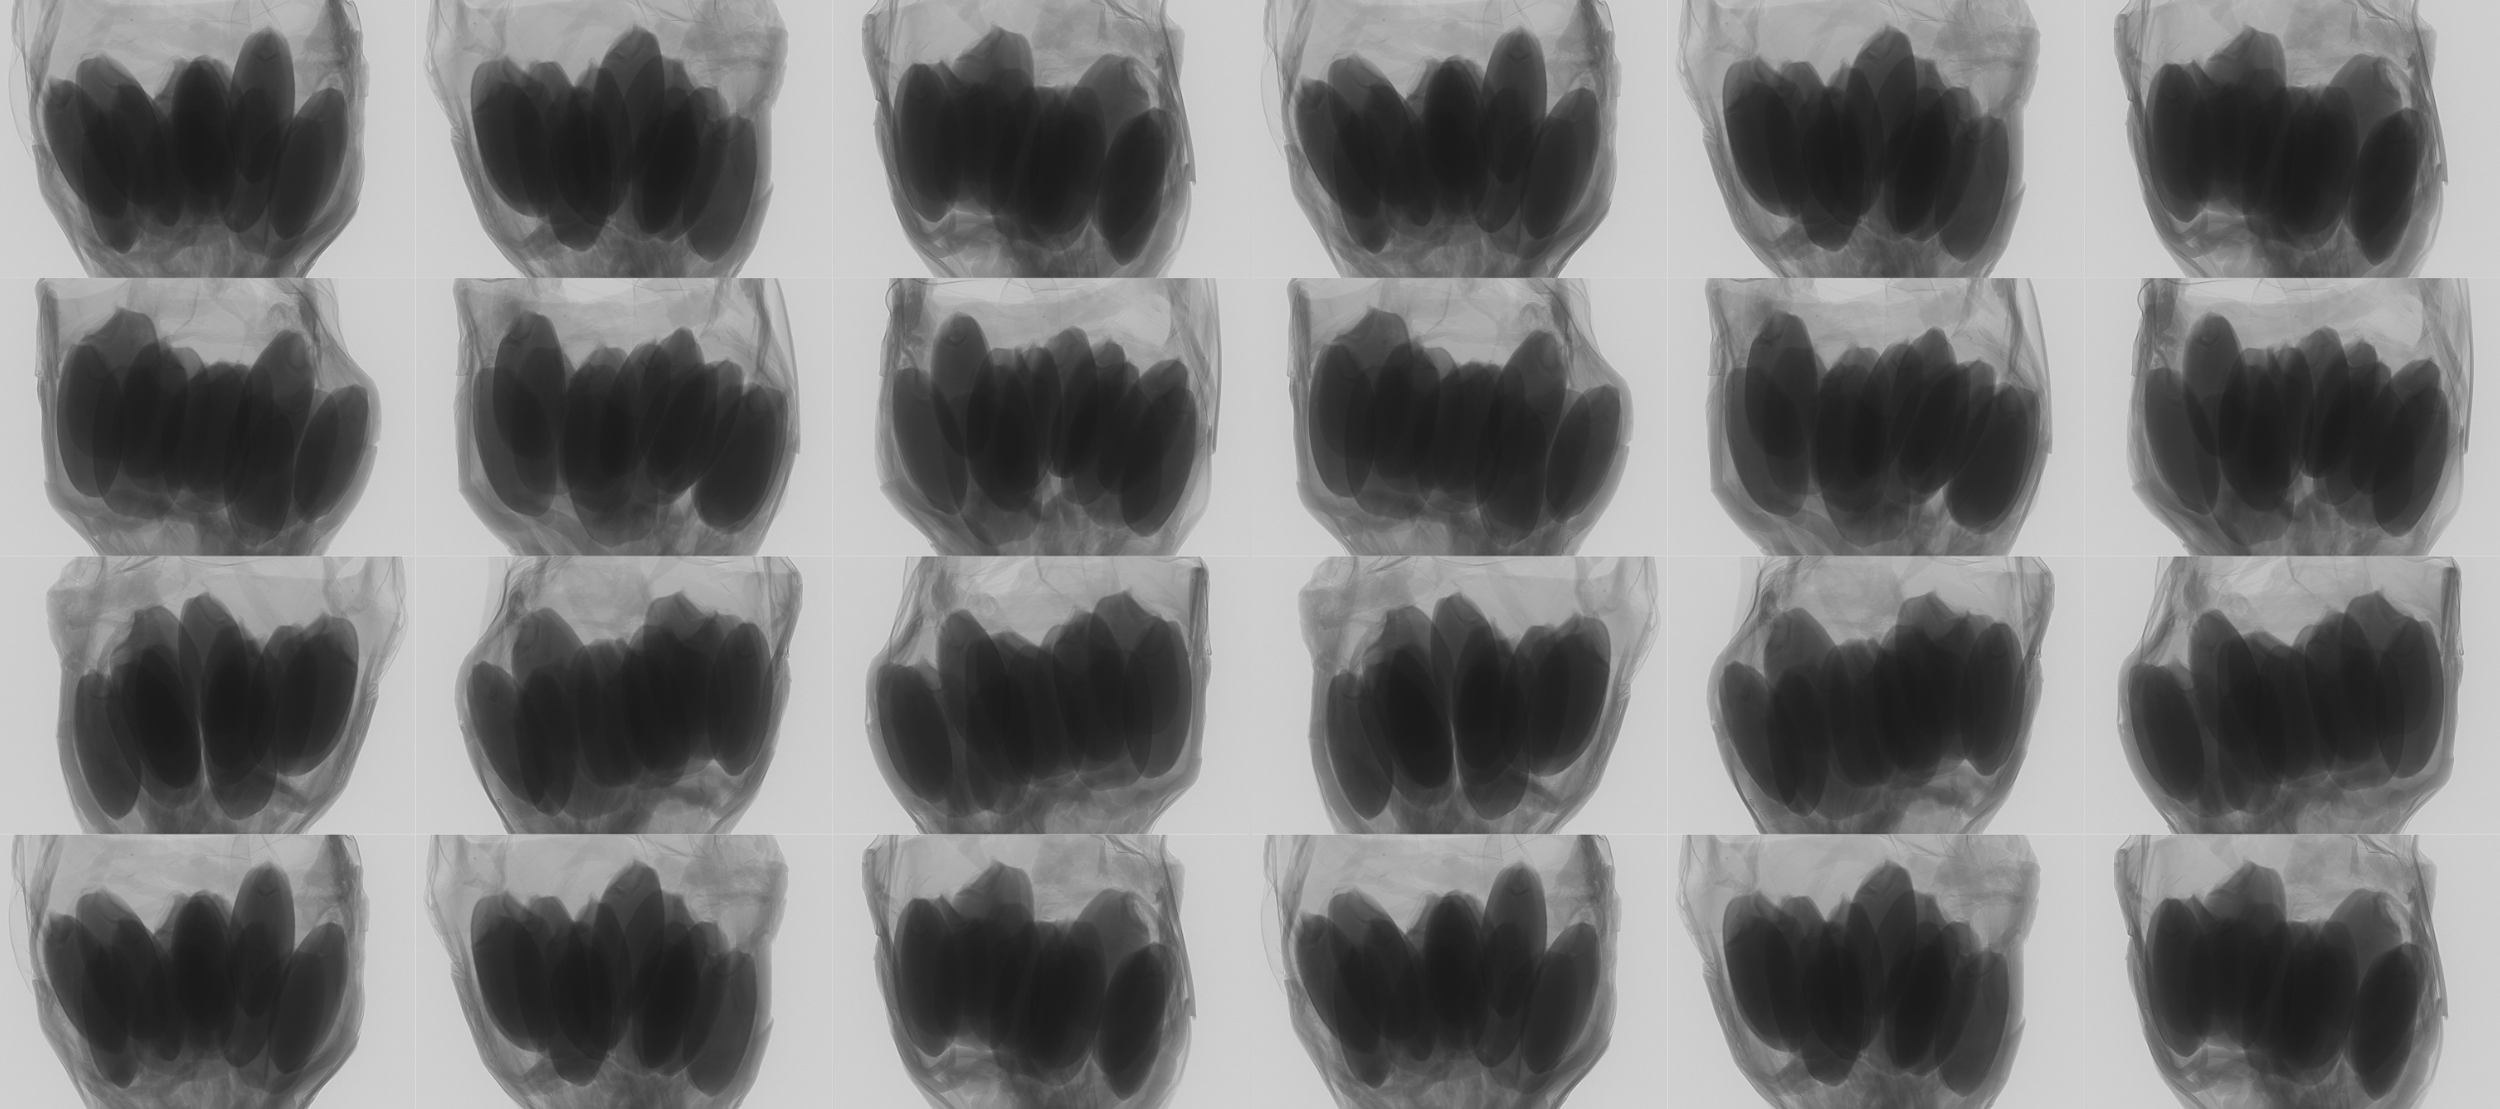
The phenotype analysis is crucial for accurately characterizing the physical traits of each variety. This involved four key steps: first, generating Micro-CT images; second, reconstructing these into 3D models; third, repositioning the seed; and fourth, segmenting each structure to get meaningful data.
01
02
03
04
Micro-CT: Micro-CT, a type of high-resolution 3D X-ray, was implemented to examine the internal structure of 215 rice varieties.
Reconstruction: 2D images are digitally pieced together using NRecon to form a detailed 3D model, enabling a comprehensive analysis of rice's internal structure and properties.
Repositioning: To accurately identify internal structures, the reconstructed seed is repositioned with principal axes for precise alignment using the SegmentGeometry module (Huie, Summers et al. 2022) within 3D Slicer v.5.1.0 software.

Segmentation: To separate internal structure, 3D Slicer v.5.1.0 software was used for the segmentation process. For more efficient labeling of the embryo, endosperm, and bran in the rice grains, we implemented the deep learning MONAILabel module(Kikinis, Pieper et al. 2014).


Genotyping
We extracted DNA from 90-day-old rice seedling leaves using the CTAB method, then fragmented and prepared it for sequencing with the TruSeq Nano DNA Library Prep kits. After verifying the fragment sizes, we conducted whole genome sequencing on the Illumina HiSeq X system, aligning the sequences to the rice reference genome. We identified nucleotide variants using GATK software, focusing on high-quality genetic markers. GWAS analysis was conducted using the remaining set of 1,254,682 high-quality SNP markers.
Statistical analysis
All statistical analyses were performed using With R statistical software (version 4.1.2). Throughout the research, we assessed the population structure (the genetic makeup of our rice sample), phenotypic variation (differences in physical grain characteristics), and correlation (the relationship between the grain's appearance traits), as well as linkage disequilibrium (LD) decay (how quickly genetic linkages break down over distance). These steps ensured our sample was suitable for GWAS.

Figure 3. The population structure of 215 rice accessions determined by principal component analysis(PCA).
Phenotypic Variation and Correlation
Distribution of grain morphological traits in rice: The distribution analysis, illustrated through histograms, showed that most traits followed a normal distribution. This indicates that our current dataset is suitable for conducting a Genome-Wide Association Study (GWAS).
Correlation: The phenotype data showed a positive correlation for most of the traits. This is probably because the inner structure becomes larger as the grain size increases. Few traits, such as grain width, and thickness showed a negative correlation with grain length, which is consistent with previous research (Rasheed, Fiaz, et al. 2022).

Figure 4. Distribution of 17 grain morphological traits in rice and Pearson coefficient correlation analysis.
LD decay analysis
In our LD decay analysis, we observed how quickly genetic linkages break down over distance, which is critical in determining the genomic distance around each GWAS peak where potential candidate genes might be located. The half decay distance, measured at 446 kb, is relatively large compared to LD intervals observed in panels consisting of multiple rice subspecies. This larger half-decay distance in our study is primarily due to the dominance of the temperate japonica subspecies in our panel(Mather, Caicedo et al. 2007).

Figure 6. Example of Manhattan plot of the grain morphology related traits.

Figure 5. The genetic structure of population revealed by LD decay analysis.
Genome-Wide Association Study(GWAS)
We then linked these visual insights to genetic data through a Genome-Wide Association Study (GWAS), a research method that identifies specific spots in the DNA that may influence how the rice grain looks and develops. For this analysis, we used 1,254,682 SNPs, which are individual variations in the rice DNA.
The peaks above the threshold represent that varieties with change in size share variations on that chromosome spot.
In an effort to identify QTLs related to grain morphology, GWAS were performed using the FaST-LMM algorithm. The threshold for genome-wide significance was set at 5.82, corresponding to -log10(0.05/33319).
Lead SNPs
After identifying significant peaks in the GWAS, a total of 128 lead SNPs across all traits were identified, with 44 SNPs associated with grain-related traits, 79 SNPs associated with embryo-related traits, 3 SNPs associated with bran layer traits, and 2 SNPs associated with endosperm volume traits

Figure 7. Chromosome map of 128 leading genetic markers (SNPs).
Find Candidate Genes
We proceeded to scan for candidate genes within a specific genomic region determined based on the linkage disequilibrium (LD) distance, narrowing down the list of genes that might be contributing to the traits of interest. The GWAS found 128 leading genetic markers (SNPs) and genes like OsYUC9 and OsPUP7 near the QTL regions. Our study found that OsPUP7 might greatly affect grain size and suggested a new link between OsYUC9, which affects a growth hormone in grains, and the size of the rice embryo.

Figure 8. Candidate gene analysis of position 5:27943303. (a) Manhattan plot for GWAS result of grain width (b) LD heat map of QTL region. The lead SNP and the candidate gene OsPUP7 is marked in red. (c) The distribution of GW, GT, GLWR, GCSA, and GV for the two haplotypes of 198 accessions. (d) The frequency of each haplotype among the population.
Result
Population structure
The first and second principal components (PC1 and PC2) divided the population into five subgroups: temperate japonica (Temp japonica), tropical japonica (Trop japonica), indica, aromatic, and unknown.
The majority of rice accessions were found to belong to the temperate japonica subpopulation, which is in accordance with their morphological characteristics.
To develop rice varieties with better nutritional qualities, it is important to understand the genes that control traits like embryo size and bran composition. This requires considering the internal structure of grains during breeding programs, rather than just focusing on external traits like shape and size. Traditional methods have limitations in exploring the complex internal structure of rice grains, but micro-CT imaging, a non-destructive technique, can play a crucial role in this. By identifying key genes like OsYUC9 and OsPUP7, we can better understand the genetic mechanisms that underlie grain development. These findings provide a foundation for future genetic research and may have potential applications in rice breeding.
Discussion
This project was a turning point for me. It pushed me out of my comfort zone and allowed me to learn new technologies such as Python, image analysis, deep learning, and bioinformatics. More importantly, it taught me the importance of collaboration. Seeking advice from experts with diverse backgrounds - my academic advisor, lab colleagues, specialists on the 3D Slicer forum, and the CT expert at SNU's Dental School - led me in the right direction and forced me to keep trying. They were the ones who ensured my success. This experience reinforced a valuable lesson: anything is achievable with continuous learning and the willingness to connect with people.


